

Nasdaq support levels


For the last several months, many have been watching the amazing run in tech and making all sorts of comparisons with the late 90s. They have been citing the high sentiment, call option activity, and equity inflows as justifications for a major market-wide crash. Instead, we’re getting some healthy sector rotation.
Since peaking in early Feb, growth stocks have taken a hit while value sectors have seen great positive performance. Gold and bonds fell with growth, providing zero protection. All this has been the running thesis on this blog.
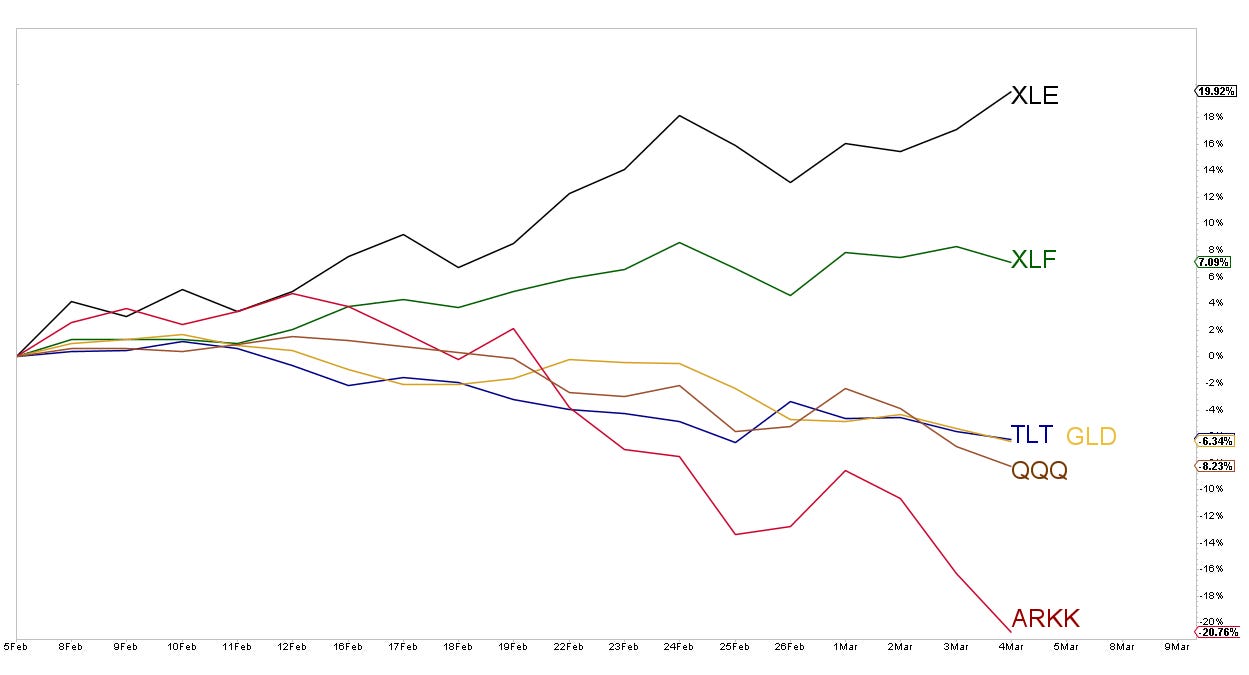
While I continue to focus on value for the medium-term, the pullback in growth could stabilize soon. Here are some support levels to watch.
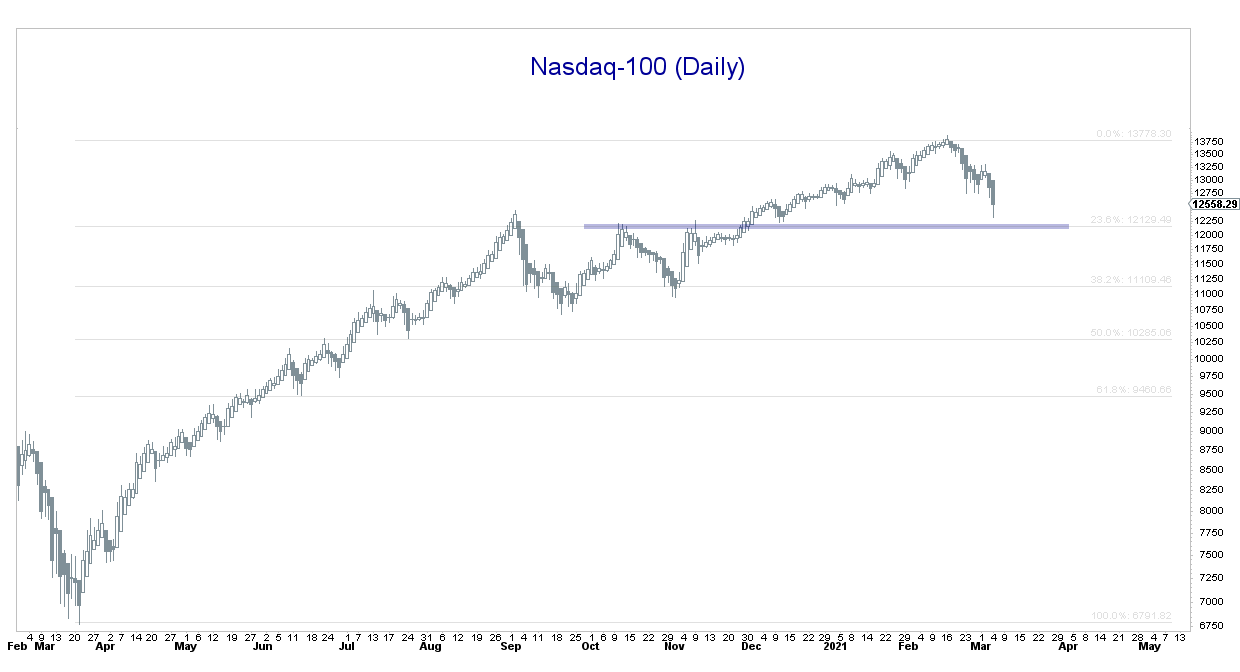
Nasdaq-100 Daily. Short-term support lies at ~12,100.
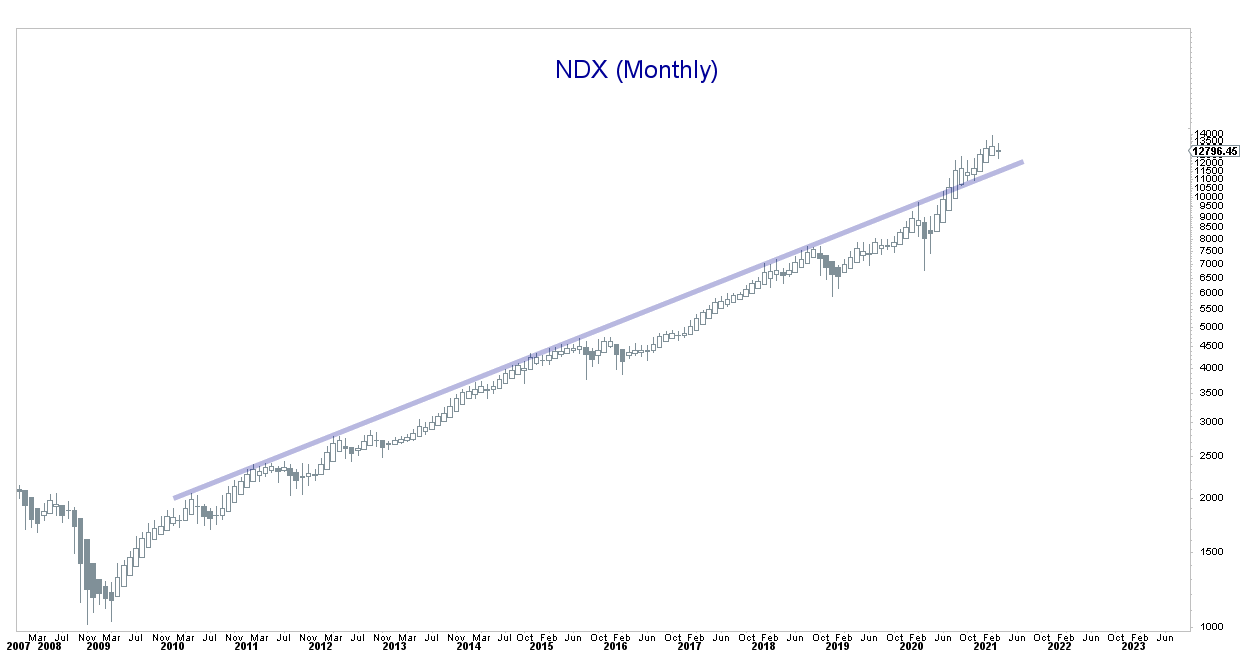
Nasdaq-100 Monthly. Longer-term support lies at ~11,500.
After finding some support, I suspect growth will chop around and build a base for some time.


You can catch knives in old leaders, but I'd rather buy breakouts in new leaders.
Important Disclaimer: This blog is for educational purposes only. I am not a financial advisor and nothing I post is investment advice. The securities I discuss are considered highly risky so do your own due diligence.