

Market review 22.12.04
Market review 22.12.04
Major market forces and the recent countertrend move

Hello everyone,
This week I want emphasize just how starkly different the market has been over the past year. And yes, there’s been some unwind in the past month to the prevailing trends which I’ll also talk about.
Not in Kansas
This has been an interesting year from an intermarket perspective:
Inflation hit 4-decade highs. Energy and agricultural commodities have been the past year’s top performers despite being in a big pullback.
Rates of all kinds responded accordingly with a sharp rise. 12 years of falling mortgages rates got reversed in just the past 3 quarters. 30yr Treasury Bonds are among the past year’s worst performers.
Stocks fell as discount rates climbed. Growth names (which have bigger earnings further out in the future) got hit harder than value names (which pay out bigger cash flows today). The Nasdaq 100 is also among the past year’s worst performers and the tech industry is seeing massive layoffs after a hiring bonanza.
USD has been rallying as rates in the US have been rising more than many other countries.
Gold is roughly flat over the past year as it’s been in a tug-of-war between high inflation and rising rates.
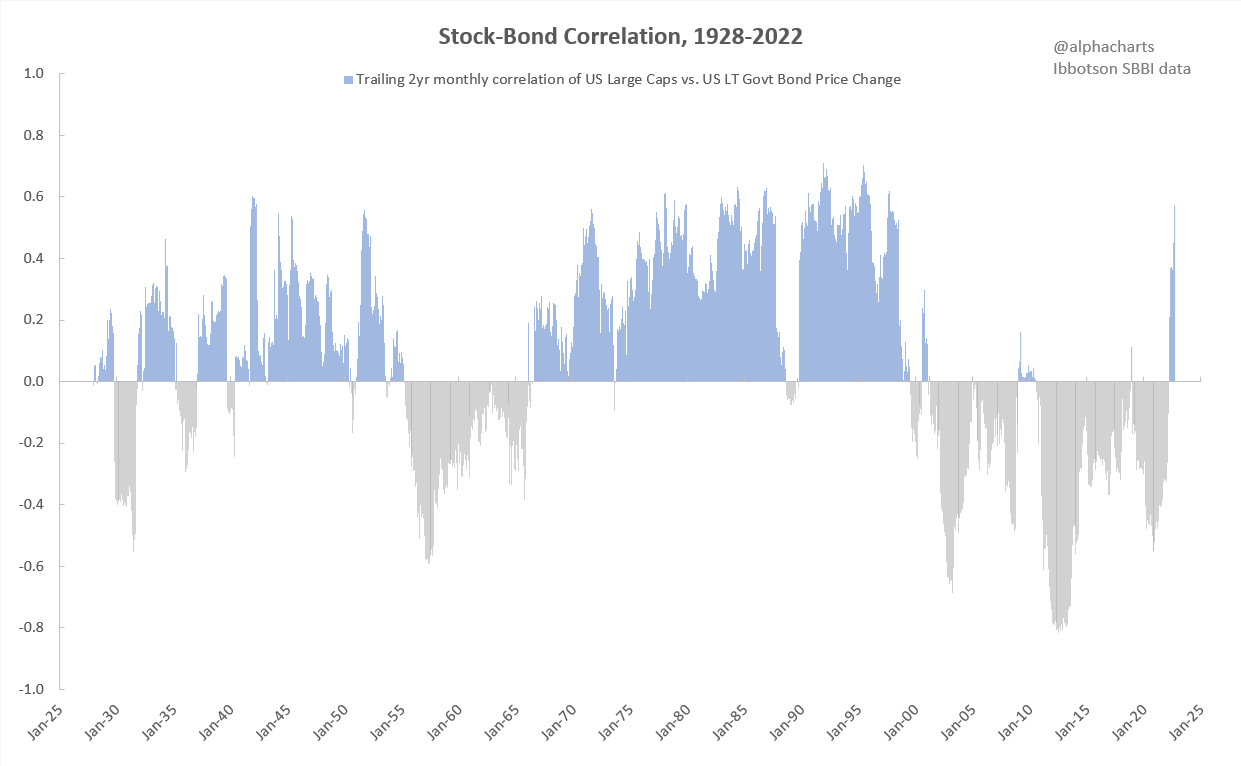
We’ve gotten so used to seeing bonds do well when stocks are weak (eg. 2008, 2018, 2020). But we’re now seeing the highest positive correlation between stocks and bonds in over 25 years:
We went from decades of falling interest rates and low inflation to the opposite. This caused a big change in leadership. What worked the best in prior years (eg. Bitcoin, ARKK, etc.) suffered the most in the past year. Meanwhile, chronic underperformers (eg. XLE, XME) did the best in the past year.
This can be seen in the chart below. It plots this year’s return on the vertical axis against the prior 5-year returns on the horizontal axis.

Recent countertrend move
A few weeks ago, we saw a big countertrend move with the US Dollar and rates pulling back. That move continued this week.
Here’s the performance over the past month and year for several popular ETFs and assets:
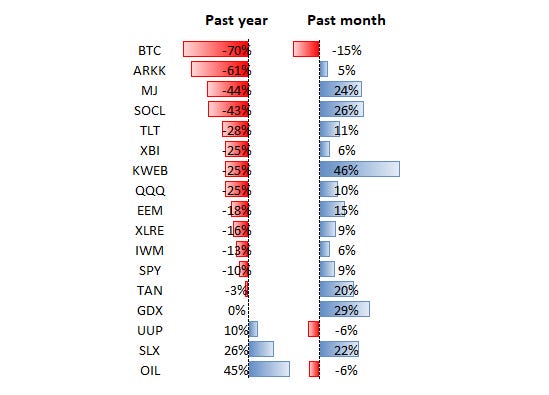
The notable exceptions to the countertrend move are that SLX was up over the past month while BTC and BLOK continued down. The resilience in materials is especially interesting and something I’ve been highlighting in the past few months.
Does the countertrend move have legs?
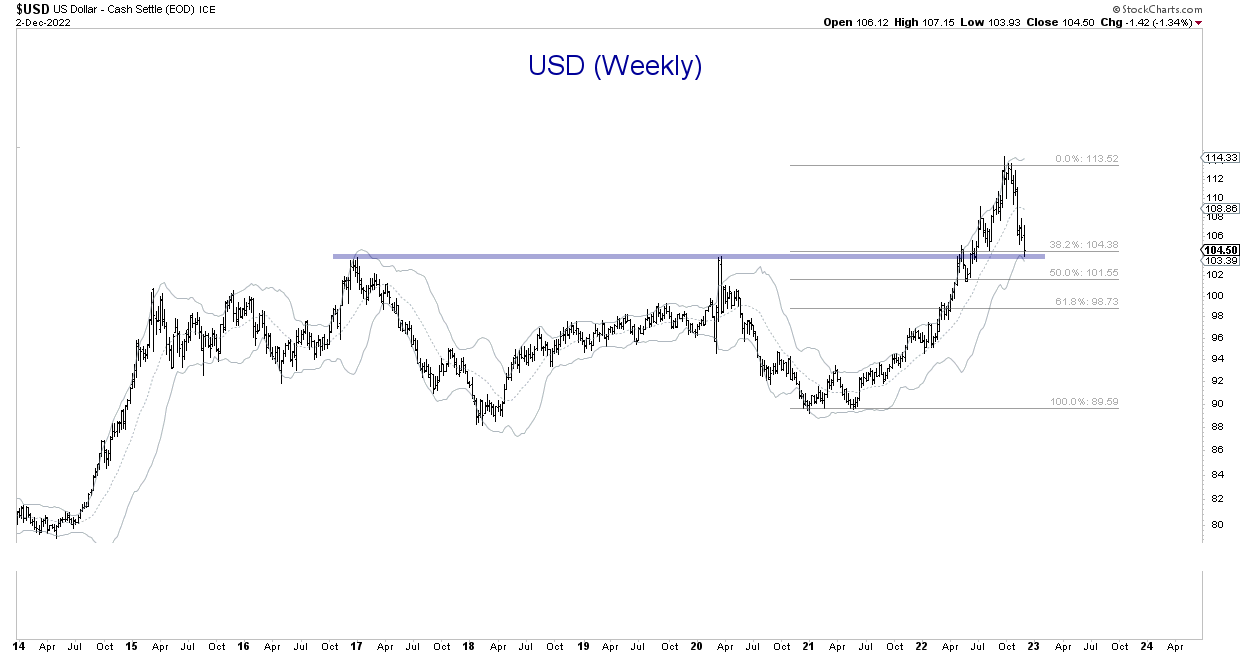
Again, the US Dollar and oil are among the few areas up over the past year. They have seen pullbacks but are now at an interesting juncture.
The US Dollar weekly chart is on a confluence of support including: 6-year base support, lower Bollinger band, and the 38% Fib retracement level.
The OIL ETN weekly chart is sitting on its lower Bollinger band. It hit the 38% Fib retracement level a couple months prior. A similar picture can be seen on weekly chart for Brent crude oil futures.
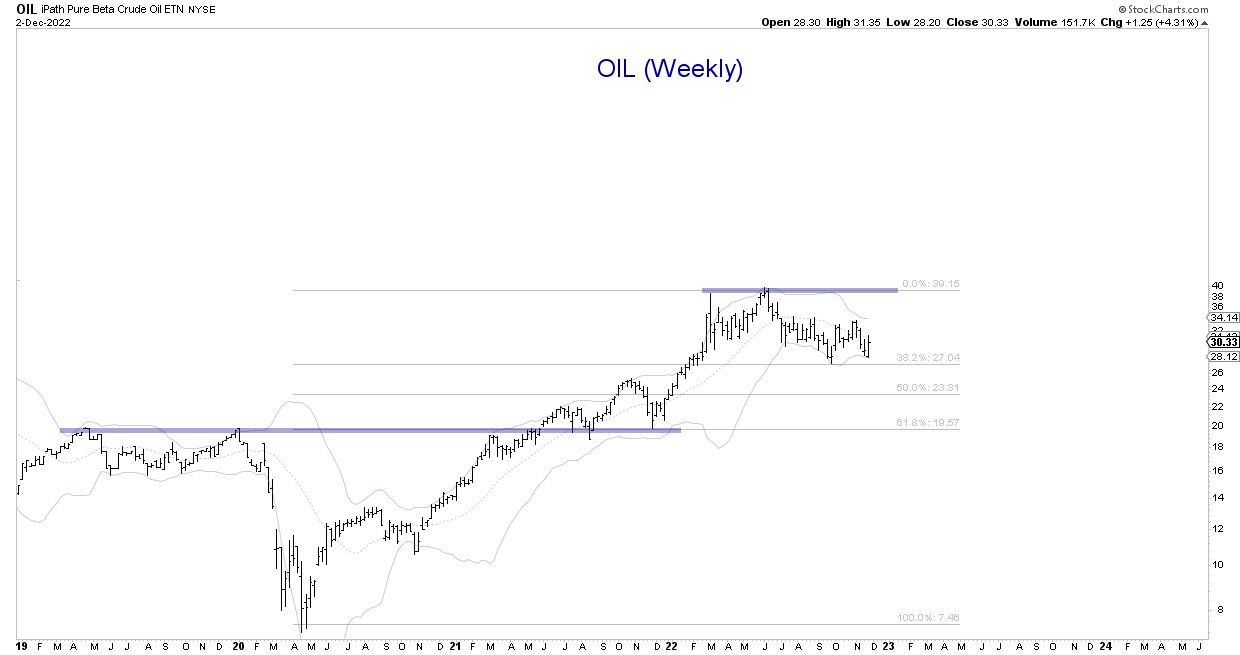
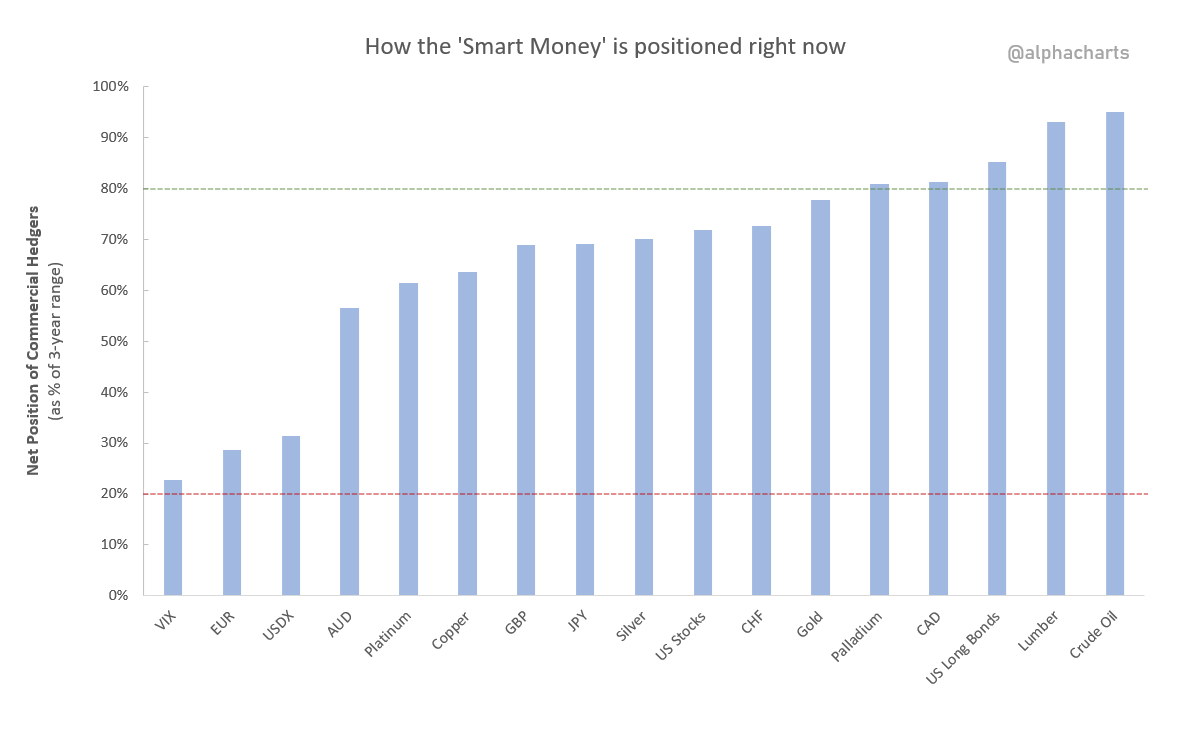
Furthermore, monthly charts for Brent and WTI crude oil show these commodities sitting on 8-year base support. Commercial hedgers continue to be very bullish on oil:
This week, China ETFs were the biggest winners. KWEB was up a whopping 25%!
Before you get too excited, keep in mind that KWEB and many other tech ETFs (eg. SOCL, ARKK, CLOU, etc.) are in severe downtrends. This China Tech ETF provides a great example of the brutal math of big downtrends:
In Oct, KWEB was in an 82% drawdown.
It then rallied 74%.
It's still in a 69% drawdown.
If you bought KWEB when it was on a “50% off sale,” you’re still down 38%.
Don’t expect these tech sectors to suddenly climb out of their deep hole and regain the winning baton.
Closing notes
The past year has been a very different market. Stocks have been under pressure while rates, inflation, and USD have seen sharp moves higher.
There’s been some unwind to this in the past month. That being said:
The US Dollar is at a confluence of support.
Oil is at a confluence of support and hedgers are very bullish. Materials (SLX, COPX) also hit major support levels in recent months, as we’ve looked at in last several blog posts.
Speculative tech stocks are still in severe downtrends.
The following few months should be interesting.
I’ll leave you with these tweets to reflect on:

That’s all for this week! If you found this post useful, please give it a like and share. Thanks for reading.
Twitter: @alphacharts.
Important Disclaimer: This blog is for educational purposes only. I am not a financial advisor and nothing I post is investment advice. The securities I discuss are considered highly risky so do your own due diligence.